SentinelOne Security Operations Centre View
Learn more about the new SentinelOne SOC View
What is the new SentinelOne Singularity Operations Center all about?
Some customers may have noticed a "Try the new Singularity Operations Center (SOC)" button at the top of their Singularity console. Once you click this you are taken to a whole new world of information that can appear overwhelming and you end up reverting back to the original console. In this blog article we will take you on a tour of the new view along with some helpful tips.
Who is it for?
The SOC view is becoming an all-in-one unified console for all things SentinelOne, bringing together telemetry information, alerts, and visibility from multiple sources such as Market Place integrations (Firewall logs etc.), Cloud Native Security, the Data Lake and many others.
The SOC view is most suited to customers with the Singularity Complete (XDR) suite and some or all of the above add-ons. Customers that just have Singularity Control and are simply monitoring EDR alerts most likely will not benefit from the unified dashboard and could find it over complicates things with a few minor additions to functionality.
Can I still use the old Console?
Do not fear, the original Singularity console is not going anywhere and will still be available for those customers that find it suits their requirements and wish to continue using it.
How to I enable / disable the SOC view?
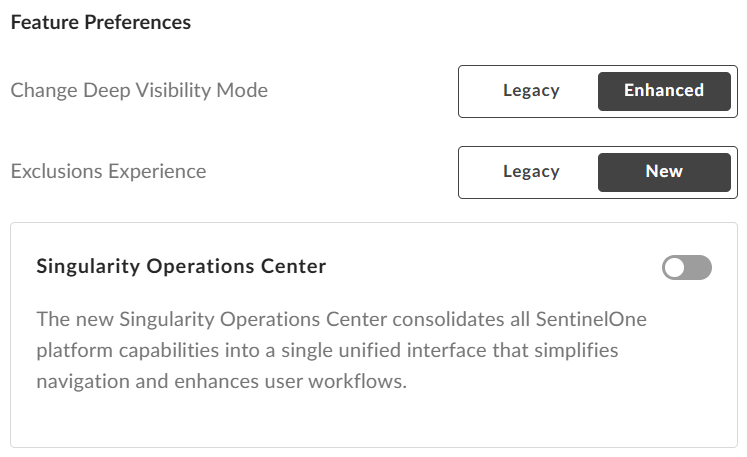
The SOC view can be enabled from your user profile top right of the screen. Simply click your user name and my user. You will then see the option for Singularity Operations Center.
The old console.

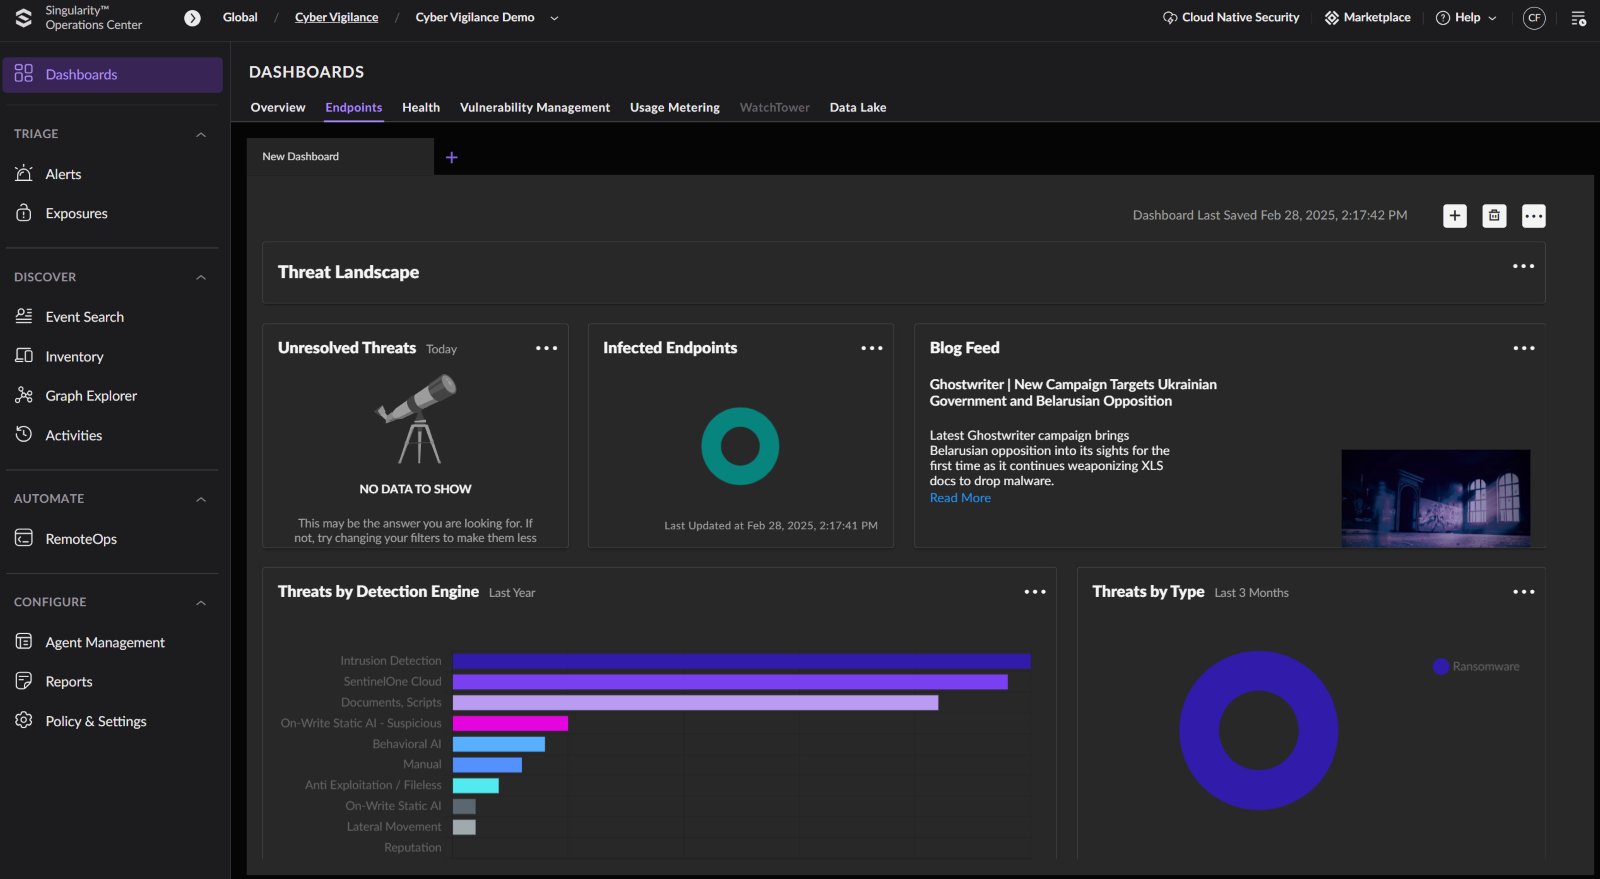
The new console.
Where has everything moved to and what’s new.
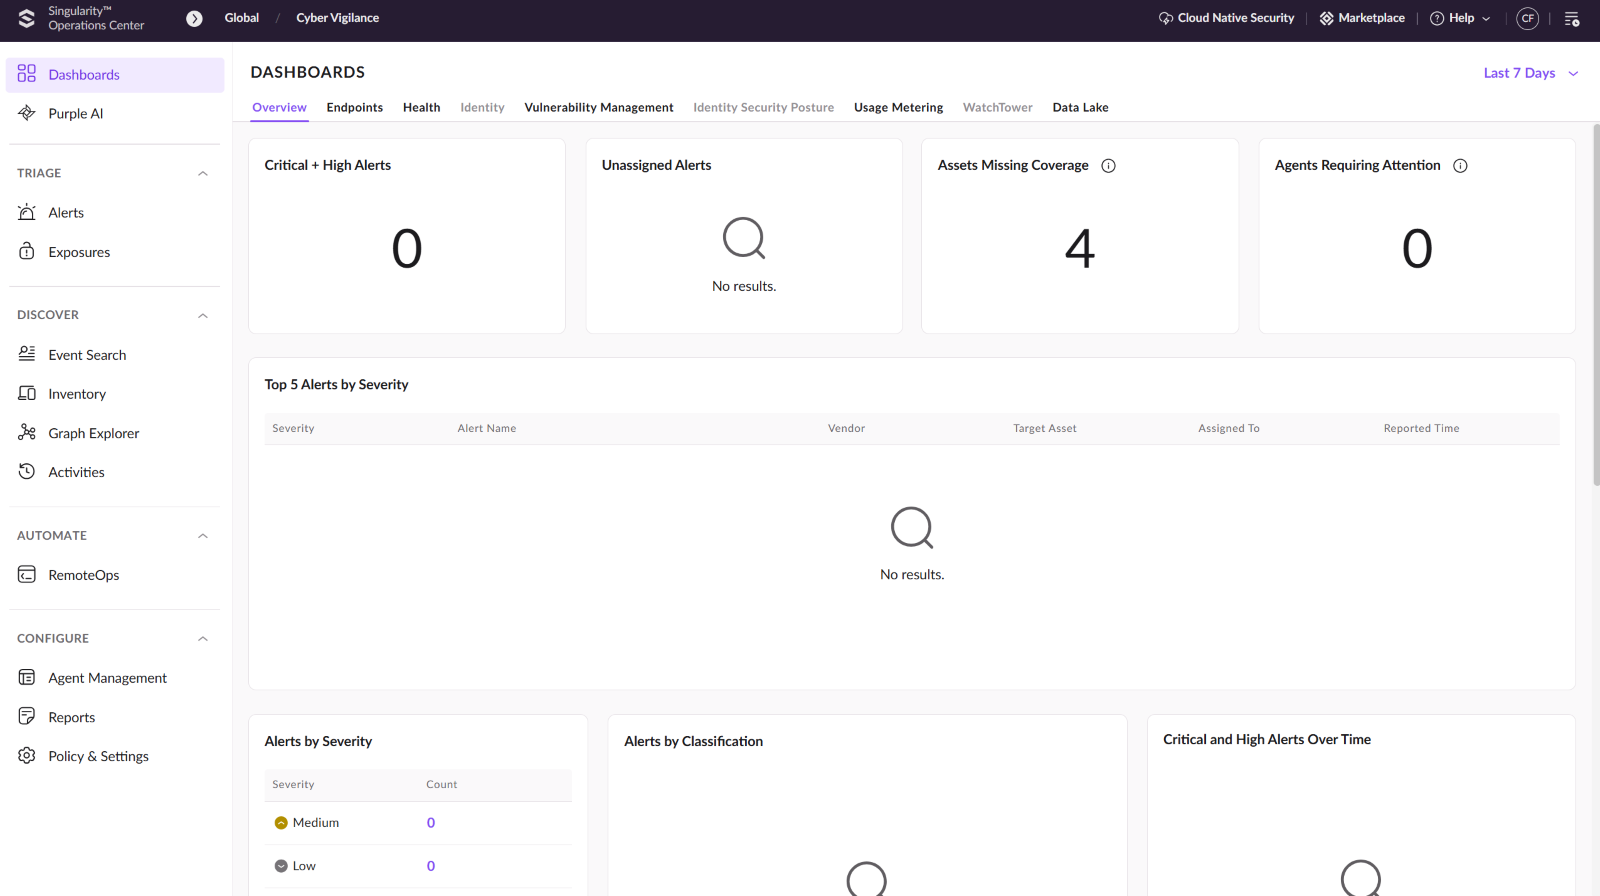
So, to show the benefits of the new system, you really need an implementation that has lots of integrations, data sources and add-ons, as you can see from the image above there isn’t a lot to look at where there is just a few agents installed, so below is a tour of the new SOC view with more data.
Viewing and Investigating Alerts:
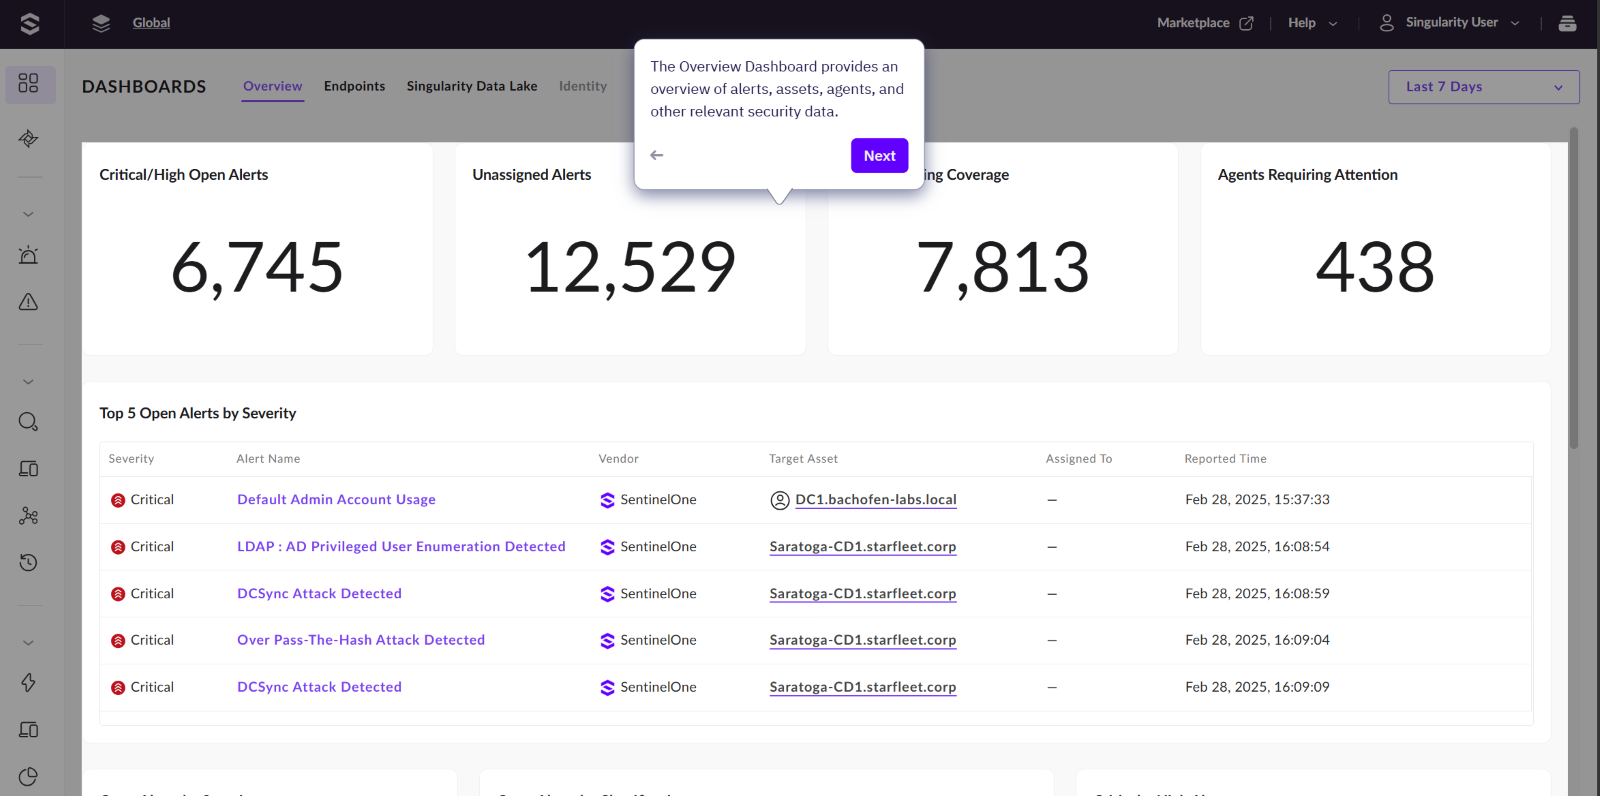
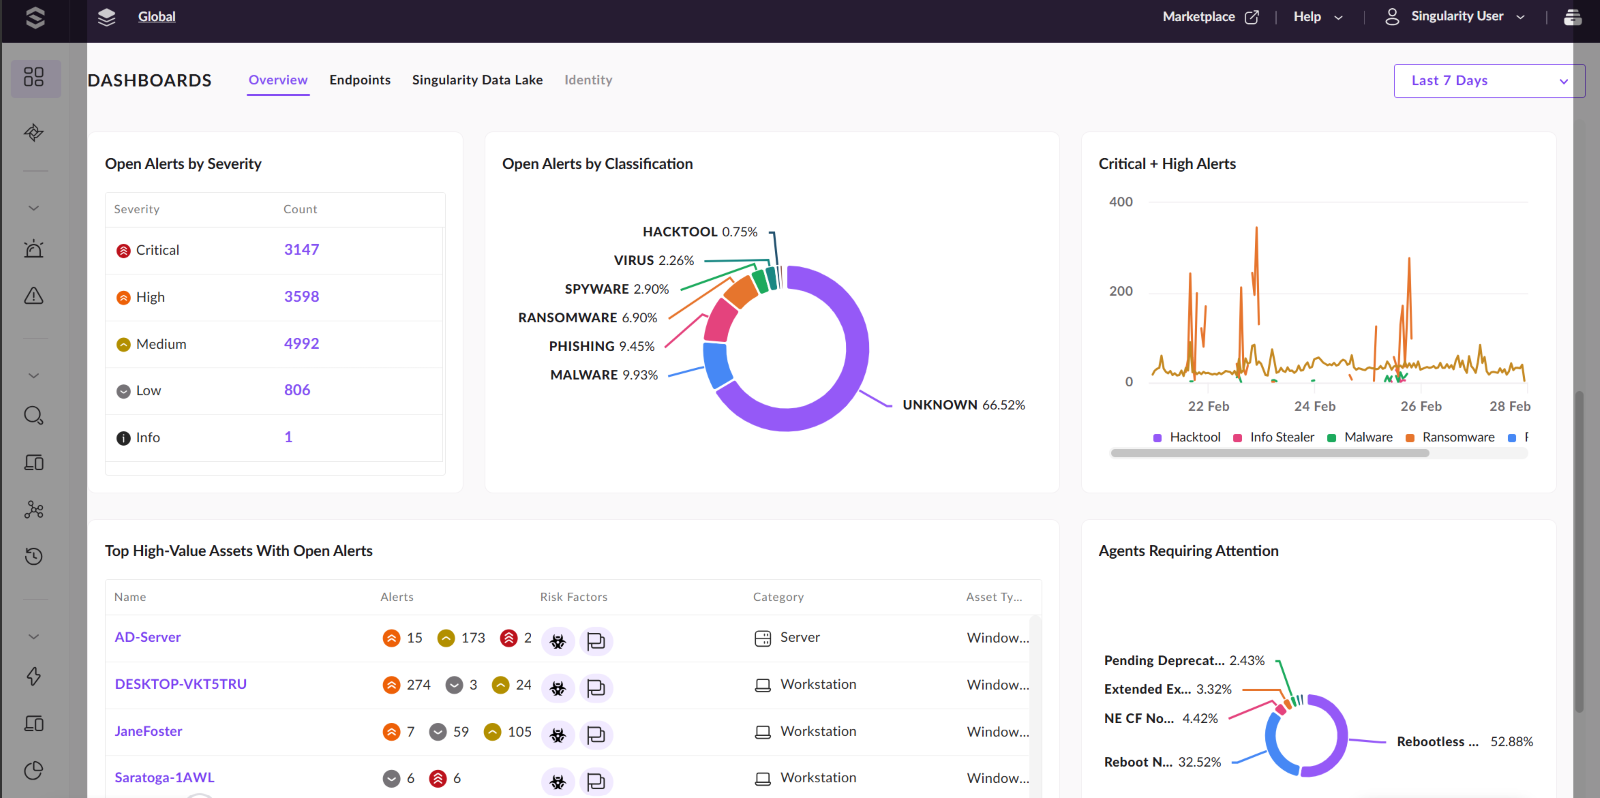
First 2 screen grabs are from the Overview Dashboard, this is where you will see an overview of alerts from all your data sources.
You now have a new navigation bar on the left of the screen designed to make it easy for SOC analyst’s workflows.
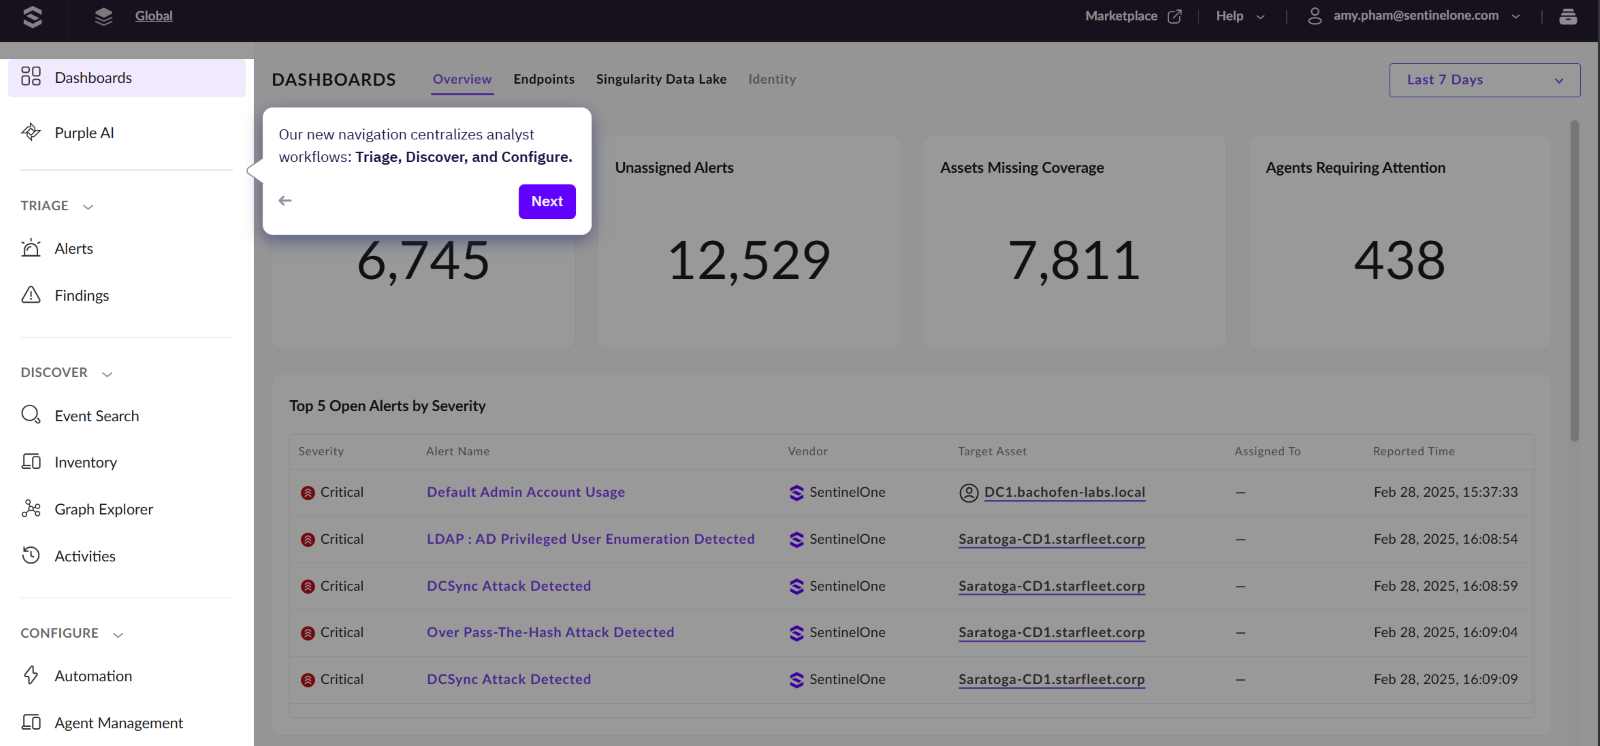
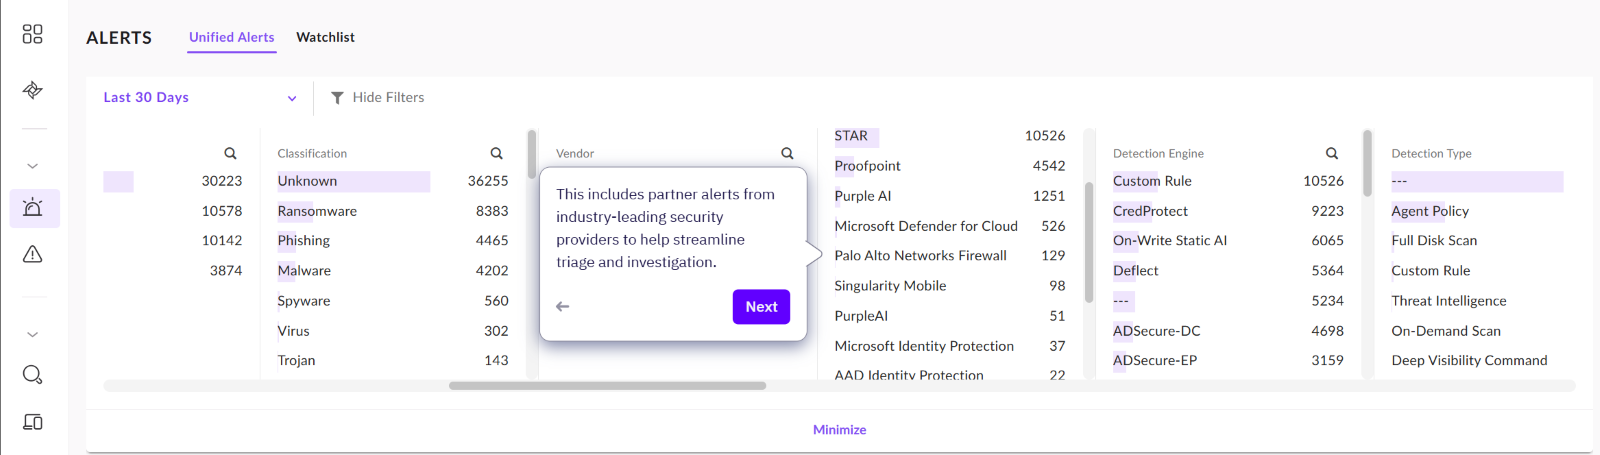
There is now a unified Alerts management interface accessed from the Alerts option under TRIAGE.

Now, lets take a look at how you can investigate a threat using this new view. The scenario below shows how we would investigate an alert initiated via a ransomware attack.
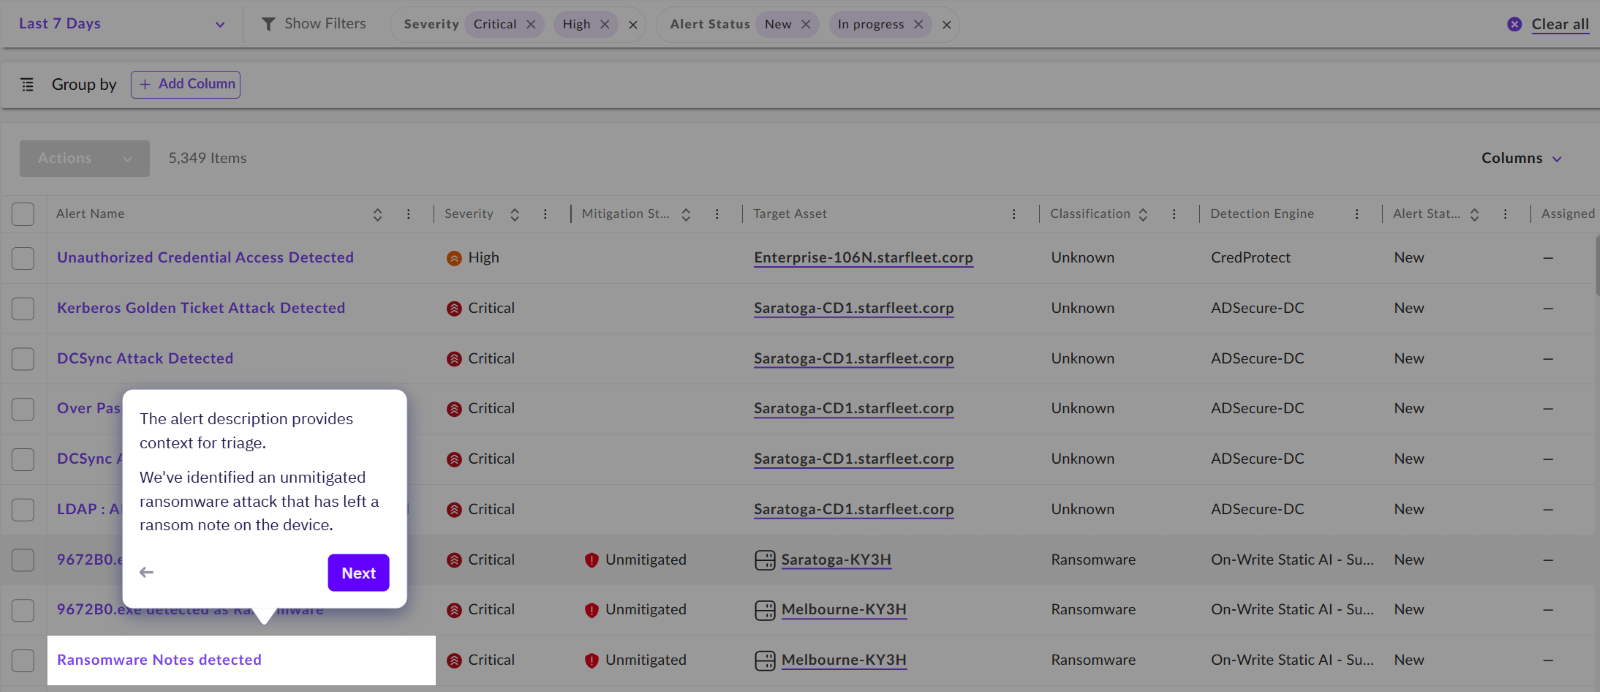
Similarly to the old view, we can still see that this alert is categorised as CRITICAL and UNMITIGATED. We are also able to see that the alert has been generated on one of the organisaion's workstations.
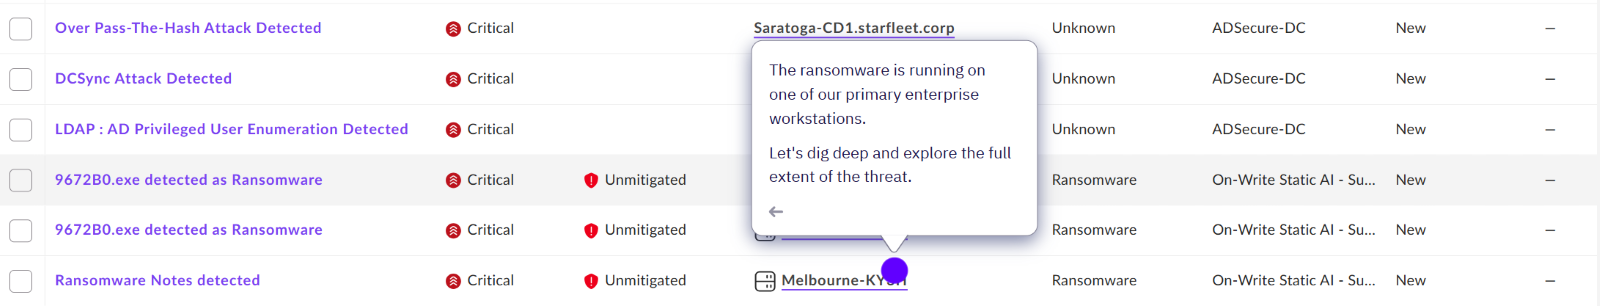
By clicking into this alert, a new tab opens with further details on what has happened.
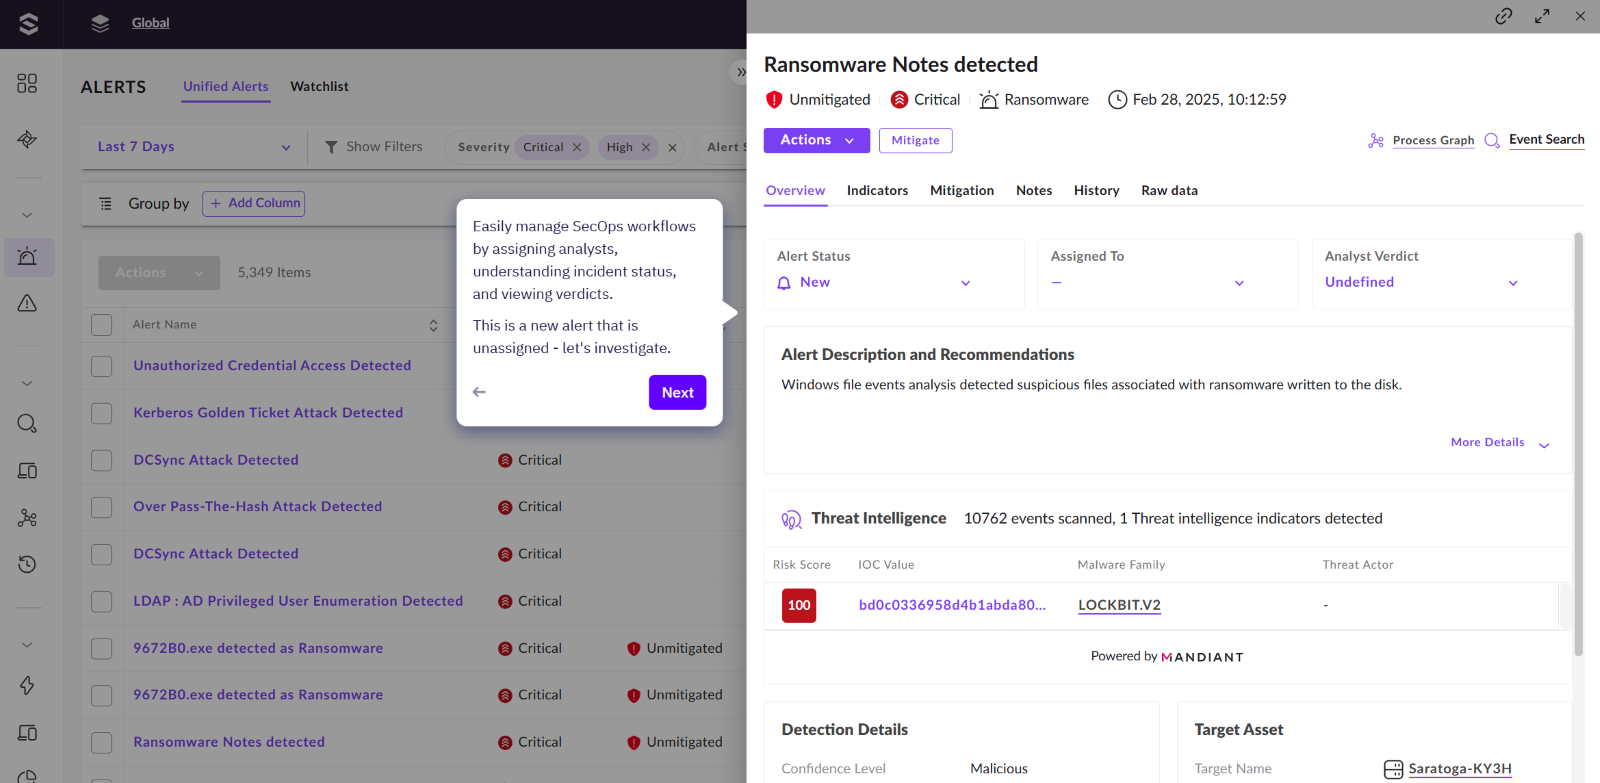
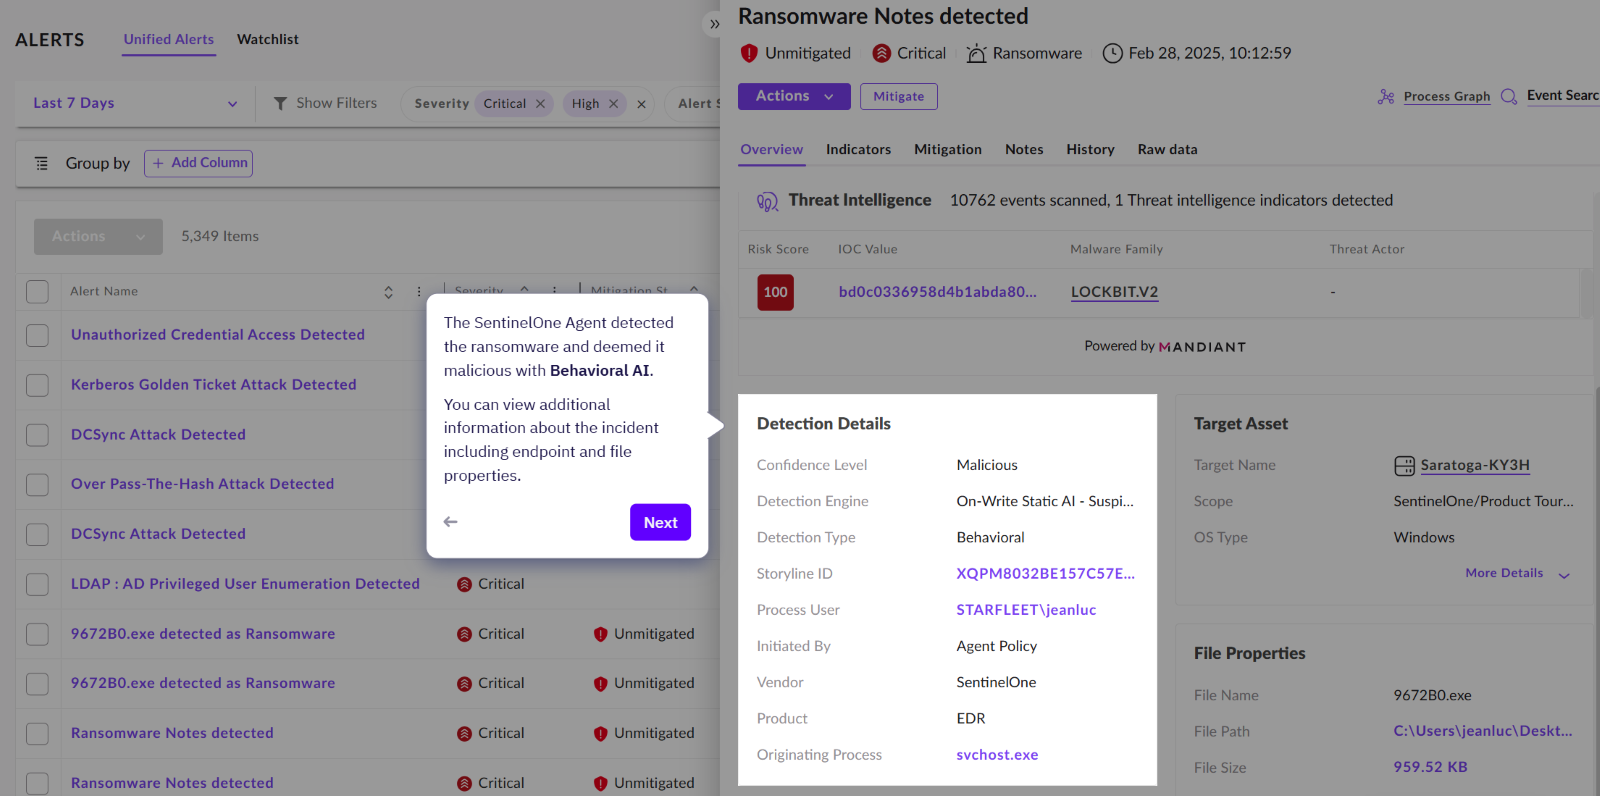
As we can have multiple data sources within SentinelOne SOC view, we can then dive into which tool/ vendor this alert has been generated from. The scenario we are walking through here has been initiated via SentinelOne.
We can also view the Indicators of Compromise (IOCs) which led to this alert being generated.

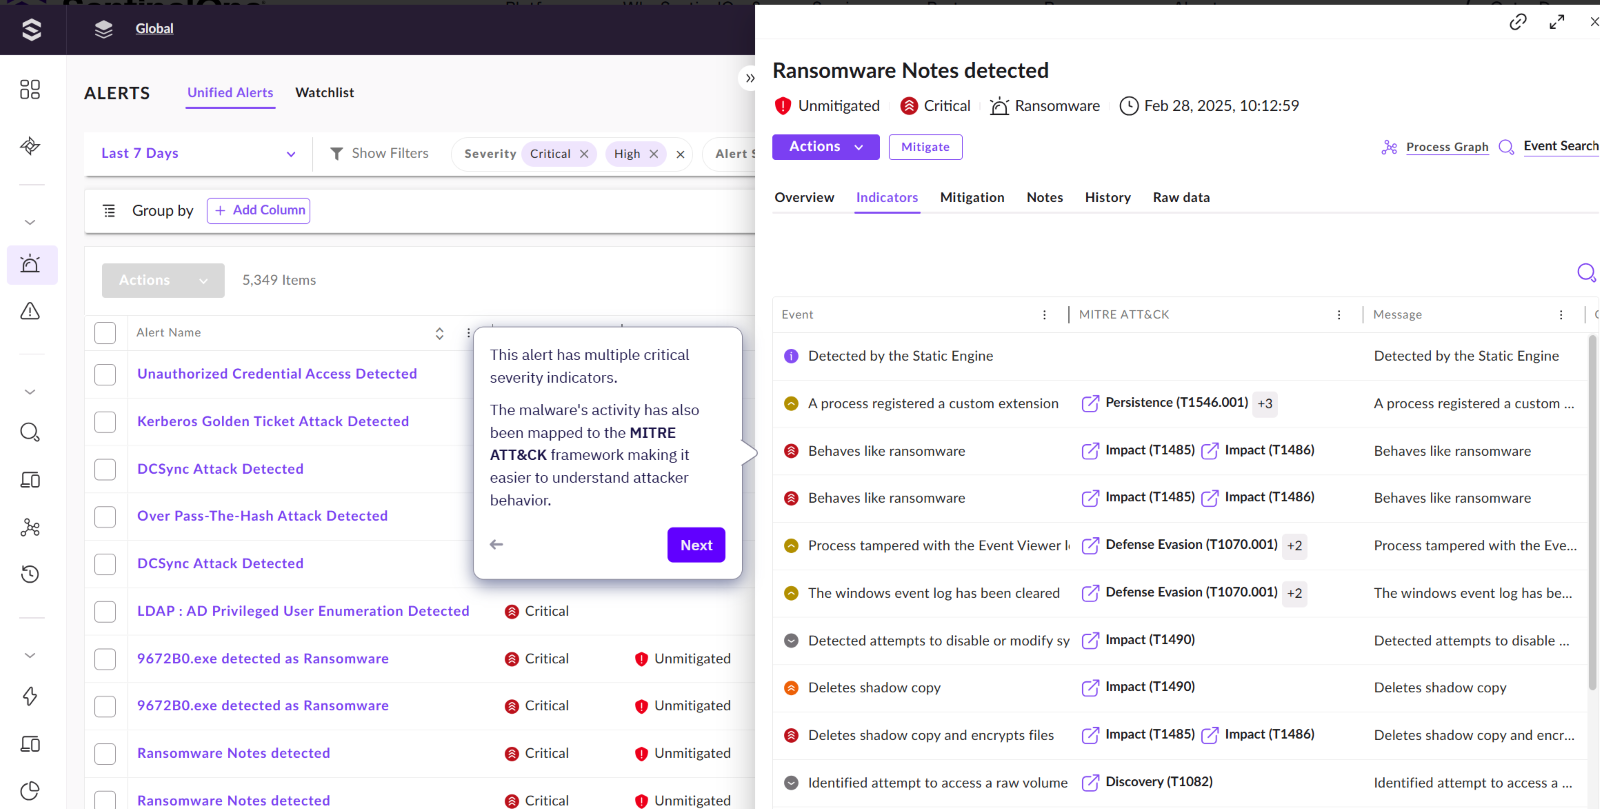
Just like the old view, these IOCs are still mapped to the MITRE ATT&CK framework, and are given a criticality rating.

Here we can see where having multiple data sources can benefit your investigations. In this alert we are told that Mandiant has provided intelligence showing which threat actor and malware family could be behind this attack.
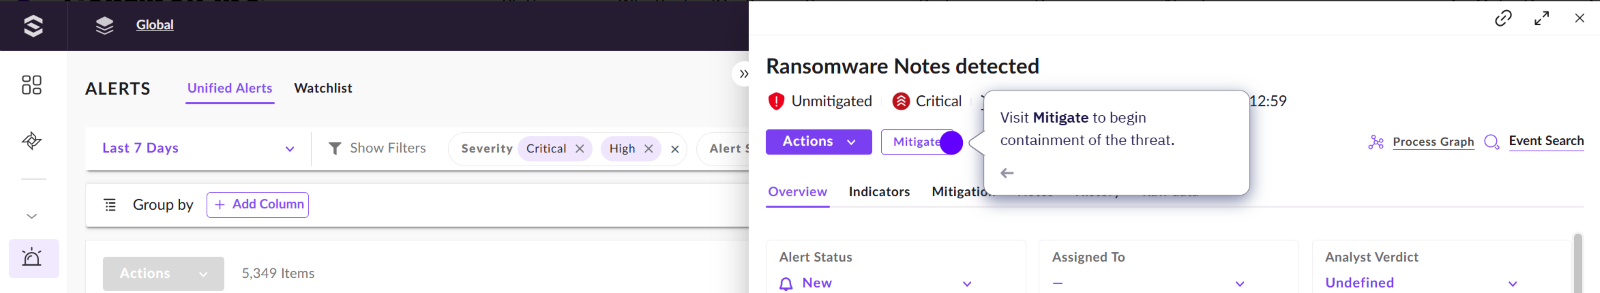
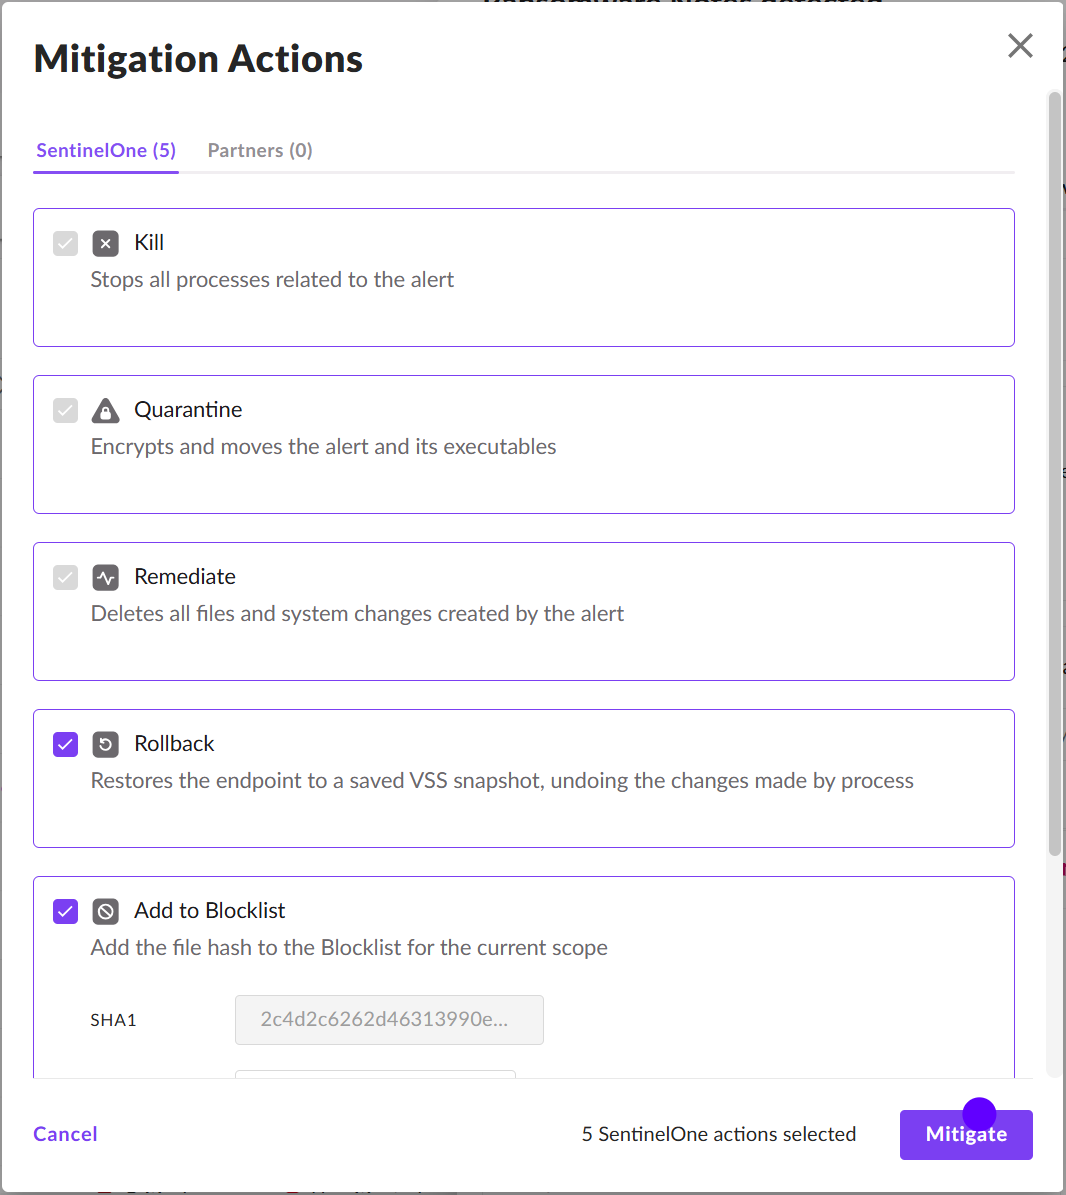
So now we have more information, we now need to mitigate this attack. Below shows that we have the exact same mitigation actions that have always been available through SentinelOne. However, depending on the data sources, we can also take more actions under PARTNERS.
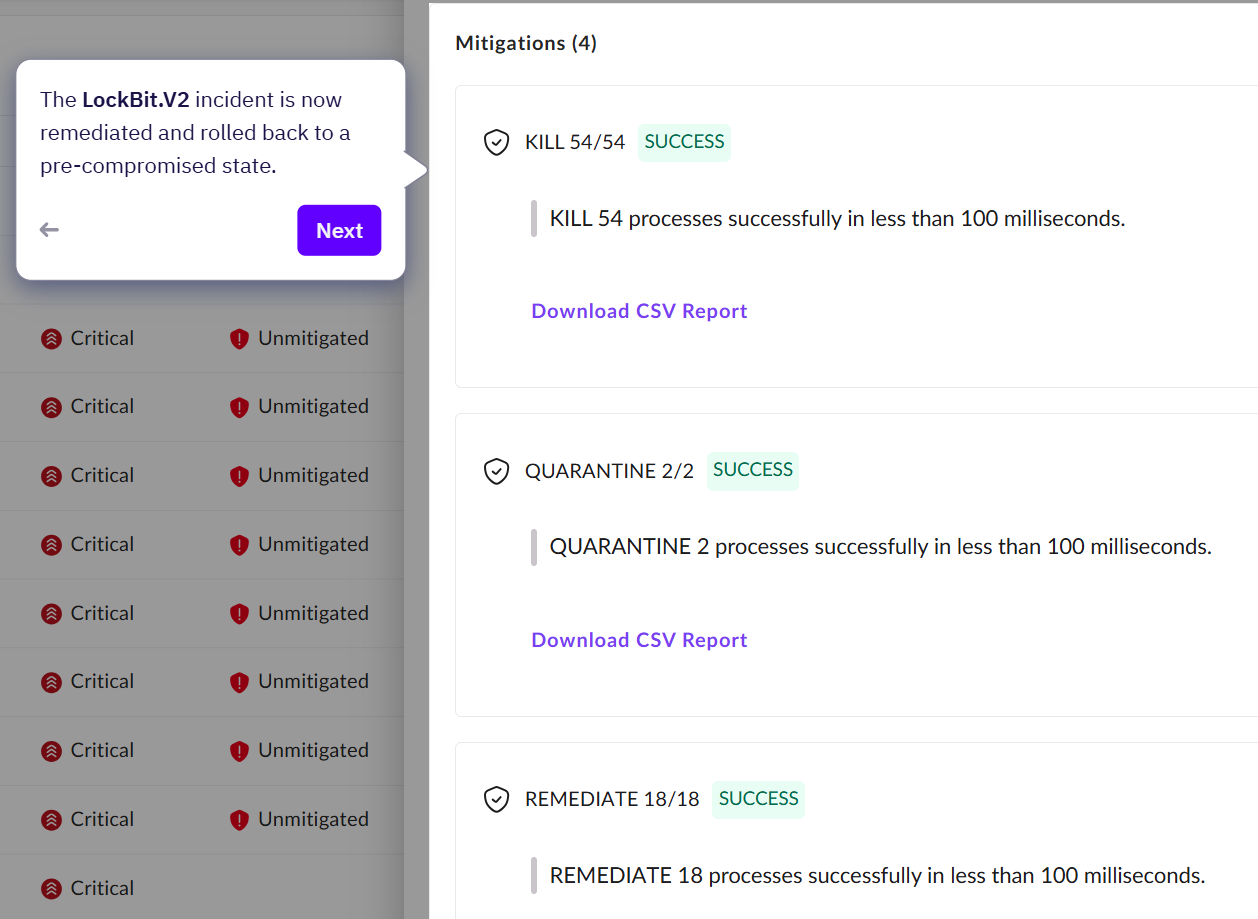
There is also a new timeline view, showing how SentinelOne has remediated this alert, using rollback.
Asset View:
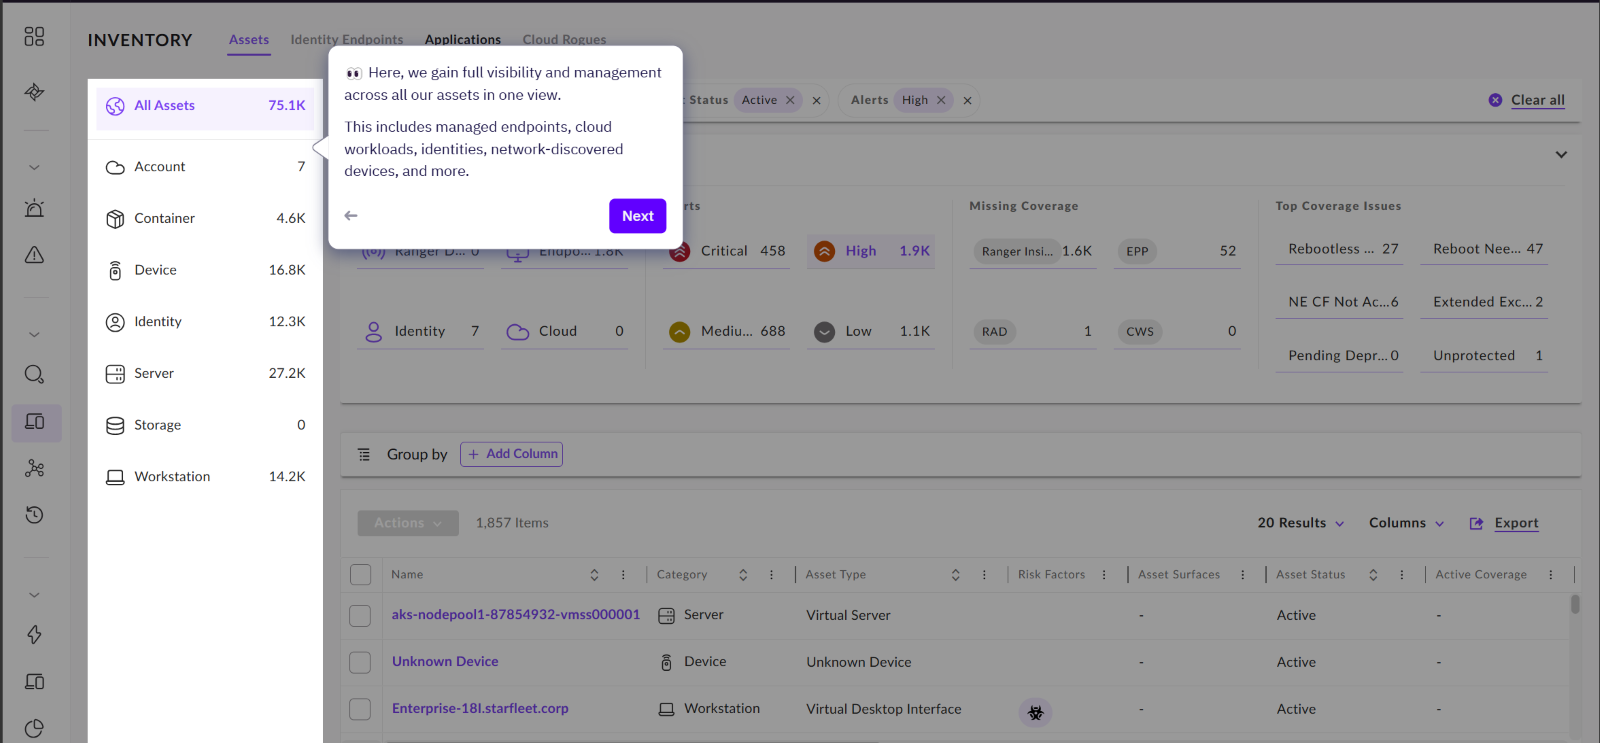
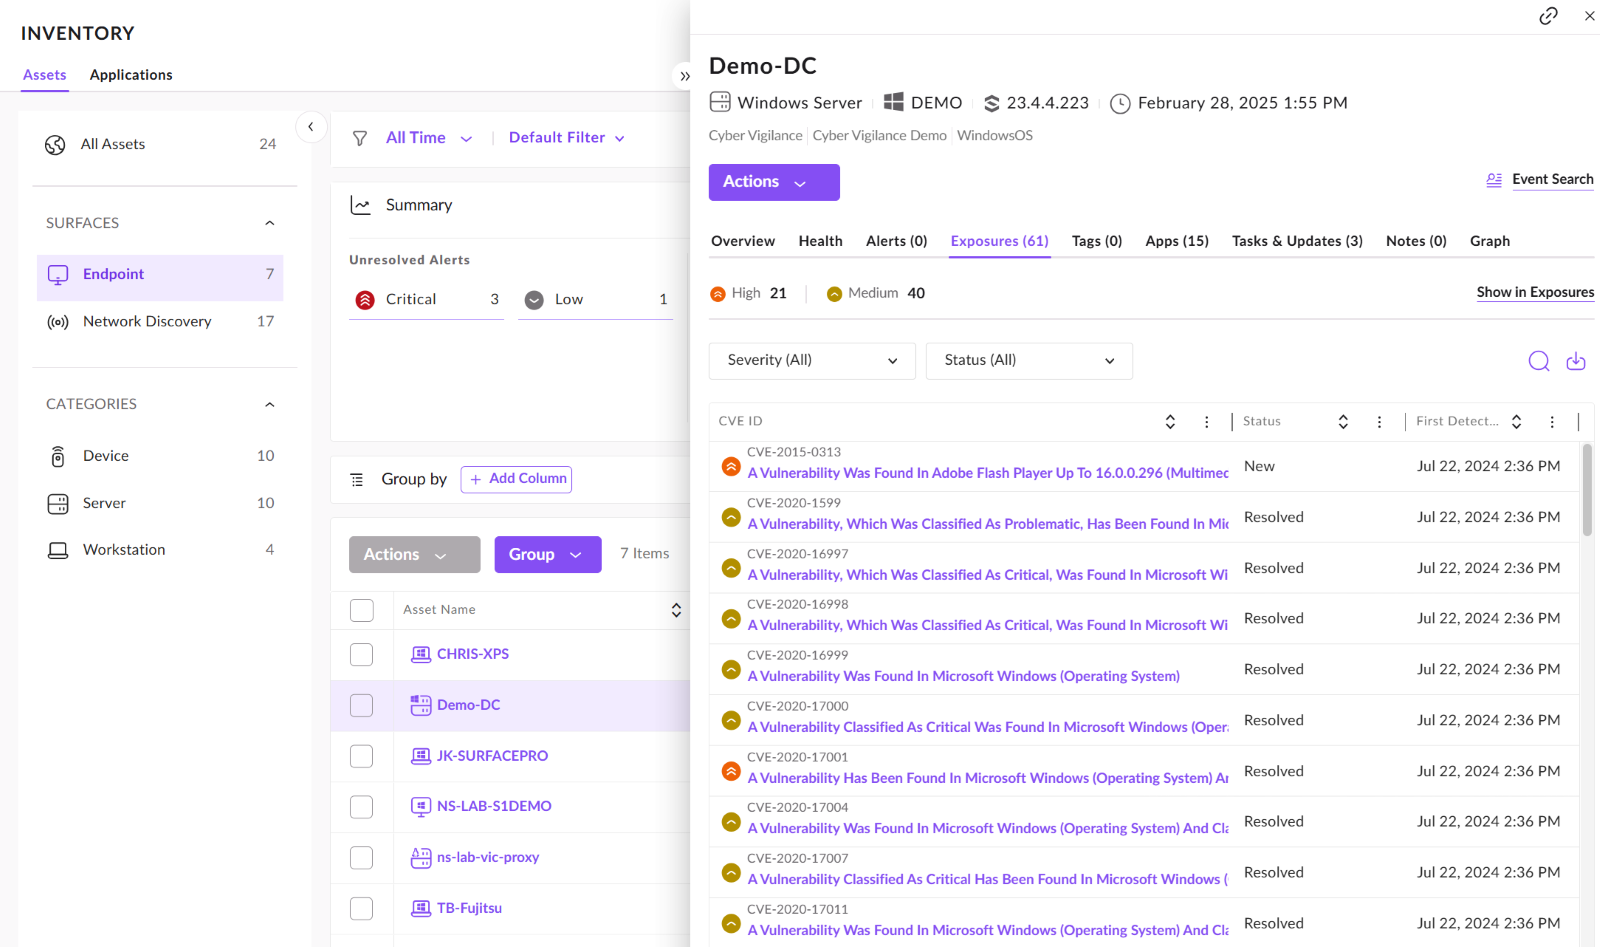
Now you have seen where the new alerts pages are we can take a look at Inventory, this is where you can see and manage all your connected assets.

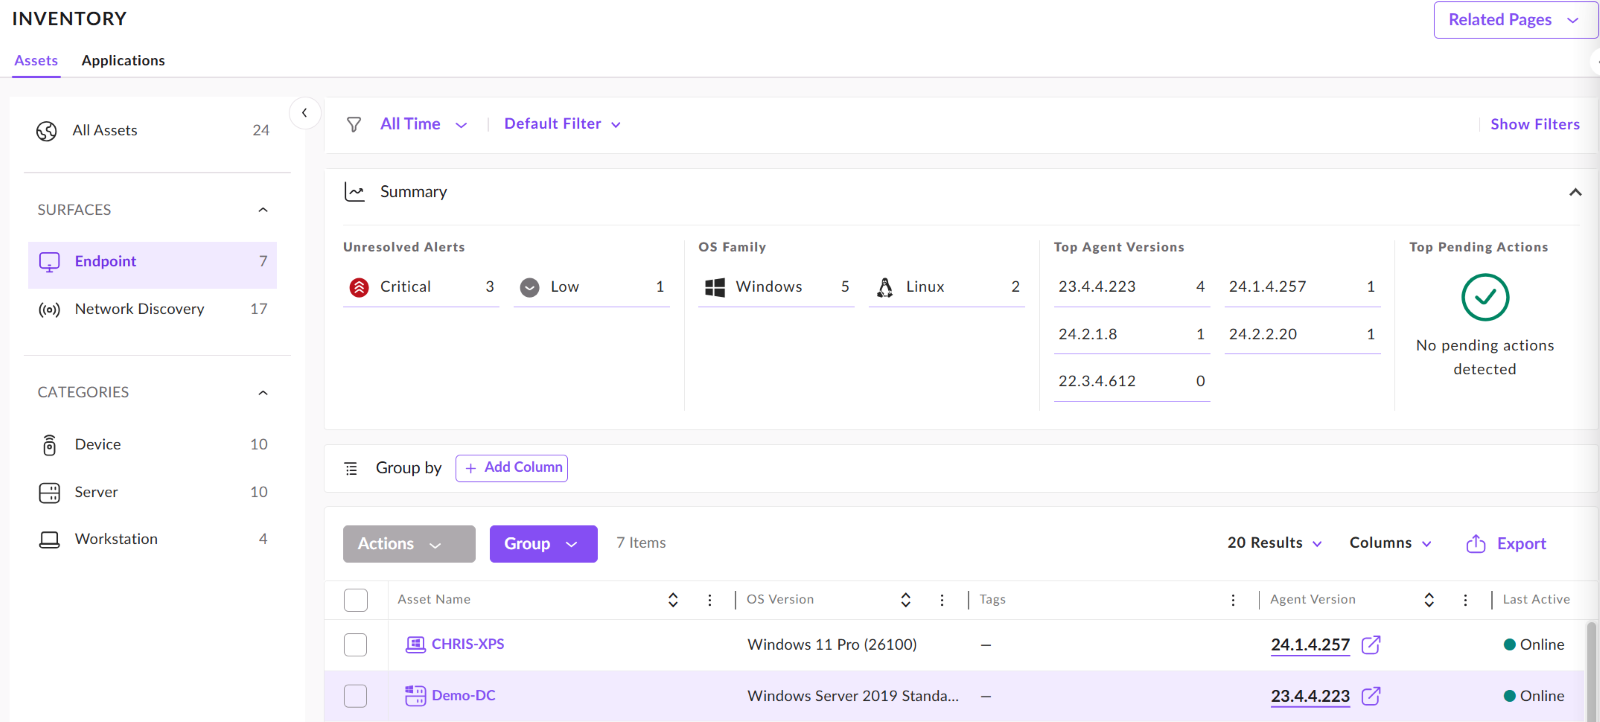
We can deep dive into any of the assets, lets look at the Demo-DC Endpoint from my demo system. You get an overview of any unresolved alerts, OS versions, Agent Versions and can drill down into any of these areas.
From this view, we simply click into the asset we would like to see more details on. From the options we can dive into the health of the agent on the device, alerts, apps and more

Under the EXPOSURES tab, we can also review the vulnerabilities on the device. We can also export these so we can ingest these into our patch management tool.
Graph Explorer:
You can also now use the Graph Explorer to investigate threats. This section of the console gives us the capability to threat hunt using the data that SentinelOne and the integrations generate.
Here we can whittle down to specific filters for such as "Workstations with critical alerts and indicators"
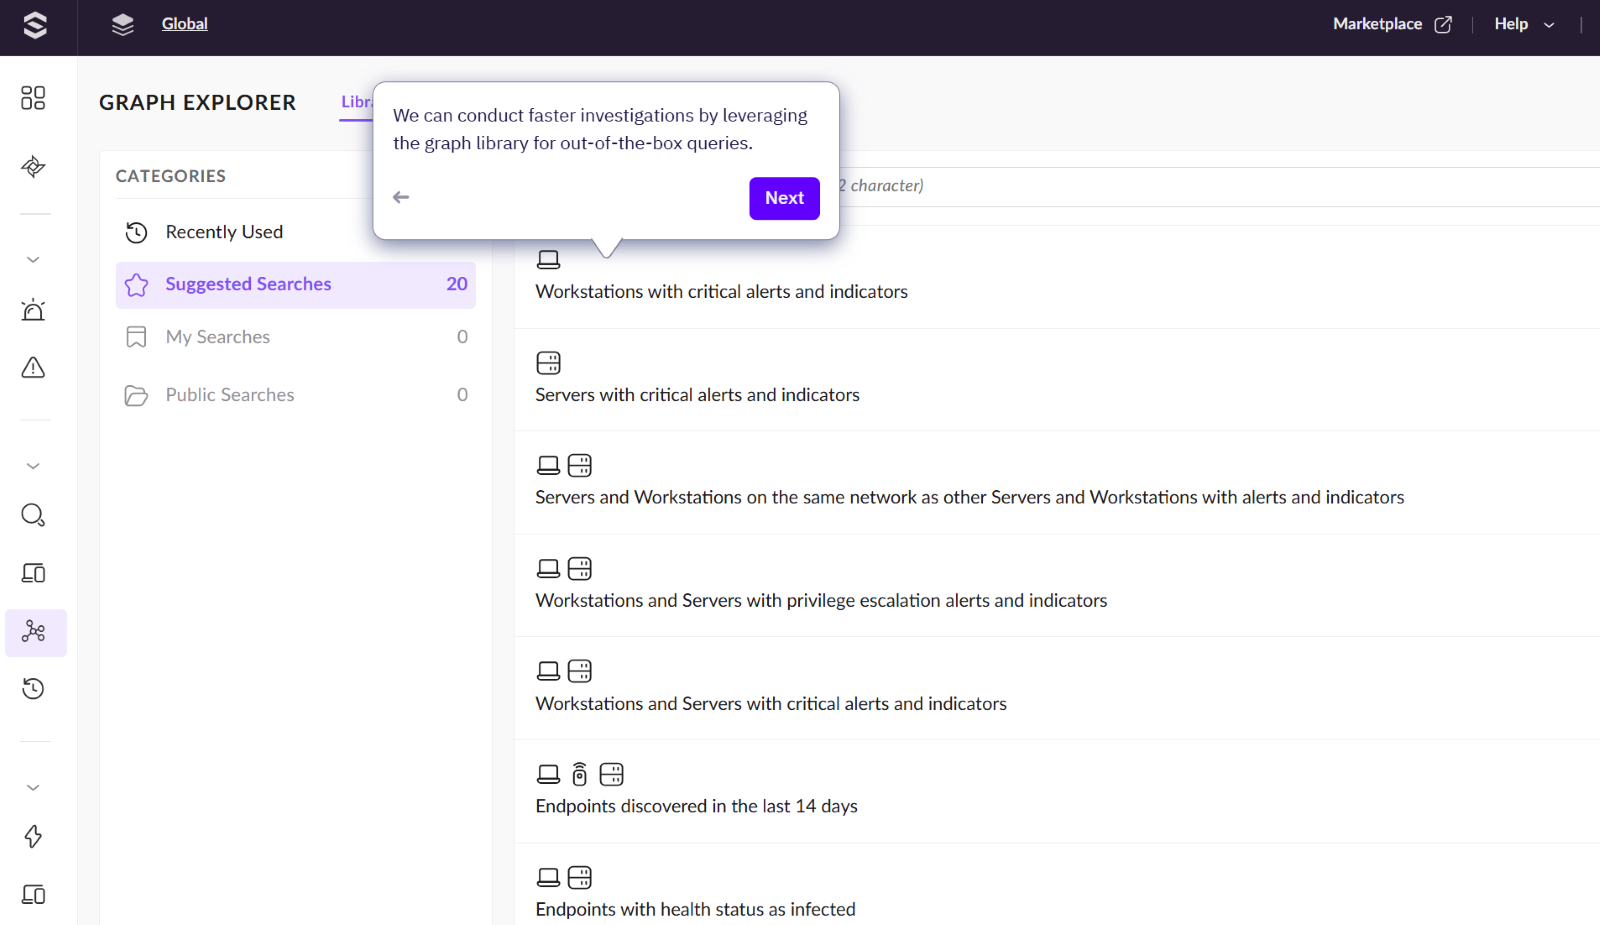
We can use these suggested searches to help with investigating and creating search queries.

Once we click on one of these suggested searches, the query builder will populate, also giving us the option to amend the query.

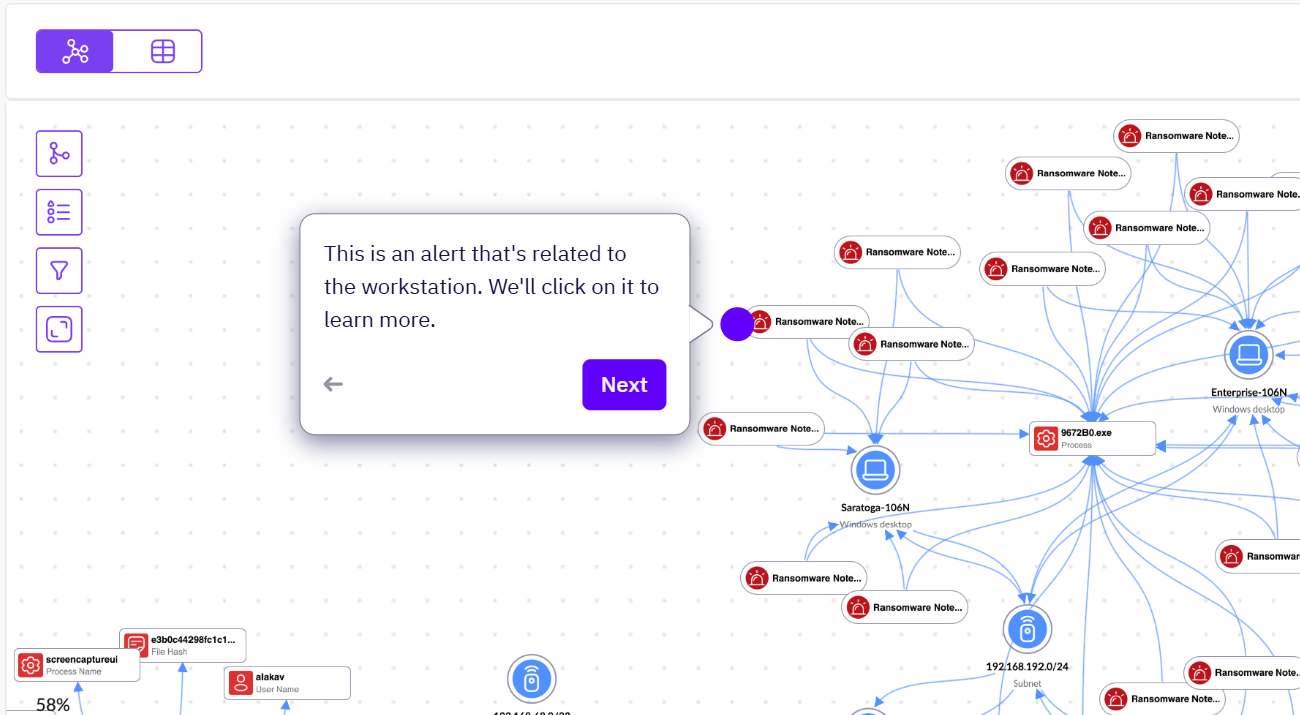
We are also presented with a graph map showing all of the assets and indicators which fit within this query search.

Zooming in closer, we can see the alerts generated - including the previous "Ransomware Note" alert we investigated earlier.

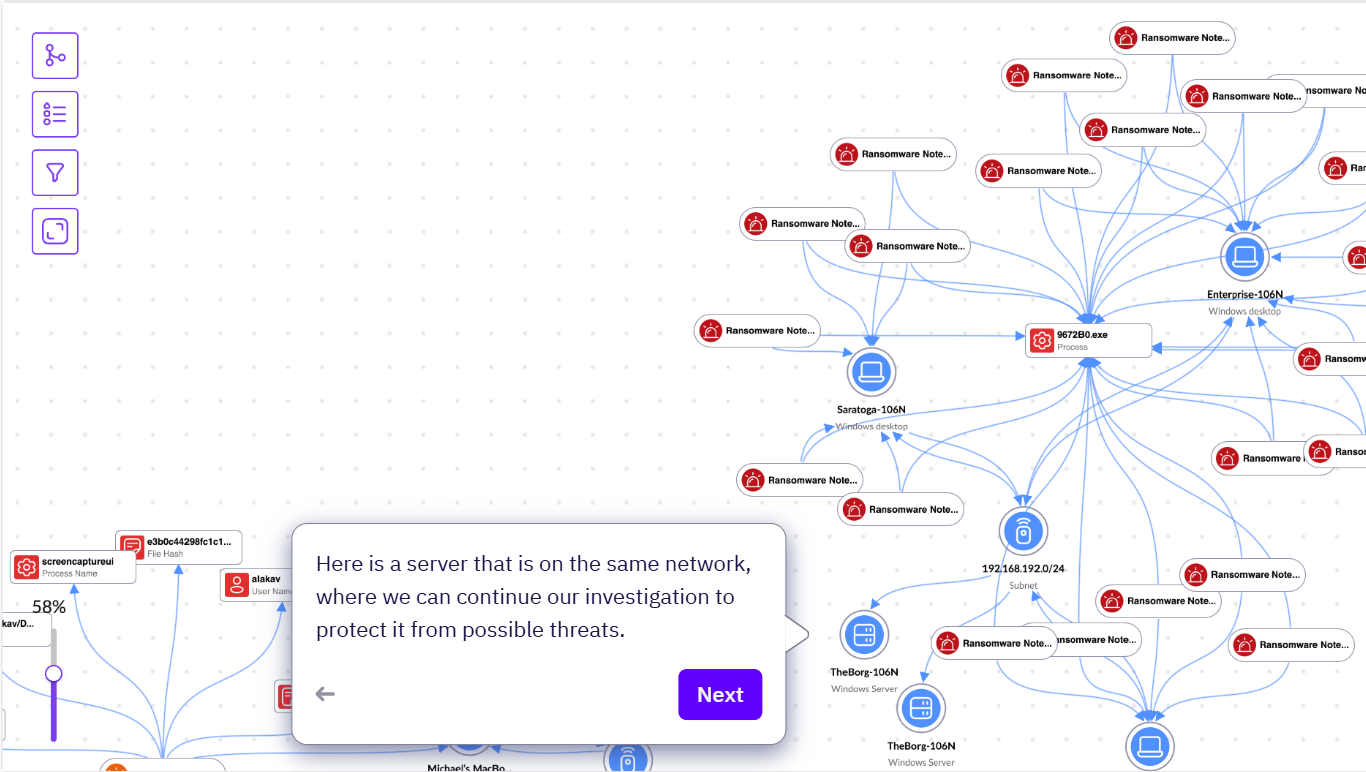
We can also see there is a server which is on the same network as the asset associated to this attack.
So in a nutshell the SOC is designed to bring all information into one console and make investigations into assets much faster. Even in the SOC view you can still see the old style dashboard, it’s just a case of getting used to where everything is and utilizing the fantastic new features.
If you wanted to see the old style view every time you open the Operations Center you can even do that by making Endpoints your default dashboard.
Click My Preferences from the icon top right of the screen and change your landing page.
Just to finish off, we also think the Dark Theme is particularly nice too 😊

Chris Faulkner
Senior Cyber Security Consultant, SentinelOne Paladin
.png)

Get safer now
See how Managed Threat Detection can make a difference for you. No obligation free trial.
Subscribe to our weekly newsletter!
©2025 Cyber Vigilance
Powered by Disruptive
Naggs Stable, Old Portsmouth Road, Guildford, Surrey, England, GU3 1LP